Following on the cluster analysis of the last post, I pairwise crossed (as in cross-multiply) the resulting cluster centers, and got three reasonably-close vectors after normalization. These were:
0 x 1: (-0.36, 0.93, -0.10)
0 x 2: (-0.23, 0.97, -0.06)
1 x 2: (-0.20, 0.97, -0.14)
While satisfyingly close, I wanted to do better.
Next I decided to take 1M random pairs of points from the raw data, cross and normalize these pairs, and then look at component-wise statistics. I ignored points within my arbitrary minimum separation of 0.5. The results were not only satisfyingly close, but also close to the values I got above.
N: 367187
M: (0.30, -0.94, 0.11) ( sum = (108760, -345150, 40391) )
S: (0.10, 0.08, 0.04)
I am now satisfied that I have the axis of nutation: (0.30, -0.94, 0.11).
Update…
Of course, I couldn’t leave well enough alone. Looking at the data over time, I found that data taken before 2018-01-14 16:41 was radically different. That was the time I mounted the monitor onto its arm on the solar tracker. <sheepish grin>
So now the cluster analysis yields
0 x 1: (-0.36, 0.93, -0.10)
0 x 2: (-0.42, 0.90, -0.12)
1 x 2: (-0.44, 0.90, -0.08)
and the random pair analysis yields
N: 272251
M: (0.350, -0.927, 0.099) ( sum = (95366, -252300, 26948) )
S: (0.07, 0.05, 0.02)
Finally, my analysis program now yields
Projection of Gravity Vectors...

normalized nutation axis 'mean': (0.352, -0.931, 0.099)
unnormalized rotation_axis (-0.93, -0.35, 0.00)
nutation_axis (0.352, -0.931, 0.099) x z_axis (0.00, 0.00, 1.00) -> rotation_axis (-0.935, -0.354, 0.000)
Sin theta = 0.995 -> Rotation angle 1.47 radians
Test Projection of nutation axis: (0.00, -0.00, 1.00)
Most recent ( 2018-01-29 18:39:45 ) theta: -10.0 degrees
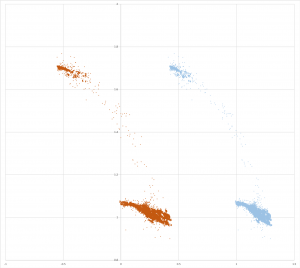
So the panel, while its elevation is as low as it goes, has an elevation theta of -10 degrees. Here is the 3D view of the raw gravity vectors now. (For more about how to see this chart in 3D, see my previous post.)

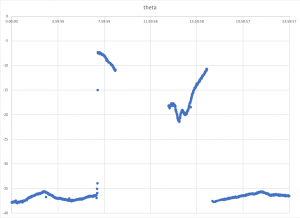
and the trace of elevation over the length of one day (yesterday):

I’m not yet completely satisfied. The plot shows a range of elevation of about -7 to about -36 degrees, for a range of nutation of 29 degrees. I believe that this accounts for less than half the about 70 degrees I think I see.
More investigation to come!